Analyzing Sewer Inspections Becomes Simple
The Sanitary District of Decatur is on a 10 year sewer inspection plan. This means that every year, 10% of the sewers are inspected. Generally, the District enters a Professional Services Agreement with a private contractor, who goes on to do the inspections. This is generally done by sending a camera through the sewer, beginning from the upstream manhole to the downstream manhole.
Every time the camera operator sees a defect, like groundwater infiltrating through the joints of a pipe or a crack, the camera stops and takes a picture. In addition, information is recorded by the operator. This includes:
The type of defect (ex. Roots Fine Joint)
A code corresponding to the defect ( ex. RFJ)
The station (location) of the defect along the sewer segment (ex. @ 232 ft. from the start of the inspection at the upstream manhole)
A rating of the defect depending on the severity with 0 meaning “nothing to worry about but something to note” and 5 meaning “A critical issue which must be dealt with as soon as possible” (ex. 2)
A categorization of the defect between Structural, Operations & Maintenance, and Miscellaneous
The defects are further weighted based on the type and length, which gives us a weighted score between 0 and 5. With this information, I created an ArcGIS Dashboard which highlights the defects which were found during inspection. This dashboard offers decision makers, such as the Outside Maintenance Supervisor and Engineering Director, a quick and easy to read reference point when deciding which sewers to clean and which to rehabilitate in larger projects.
Cleaning Old Data
SDD began using The National Association for Sewer Service Companies’ (NASSCO) Pipeline Assessment Condition Program (PACP) in 2009. They began digitizing this data in 2015. The previous GIS Technician saved the data in the following manner:
What’s important to note is that the “Defect Description” column contains a lot of data; not only does it include the type of defect (Water Level), it includes any little notes the operator thought to include (50%).
After doing SQL queries on this dataset throughout the past few months, it became clear that it would be MUCH more versatile and query-friendly if the Defect Description column is separated into multiple levels.
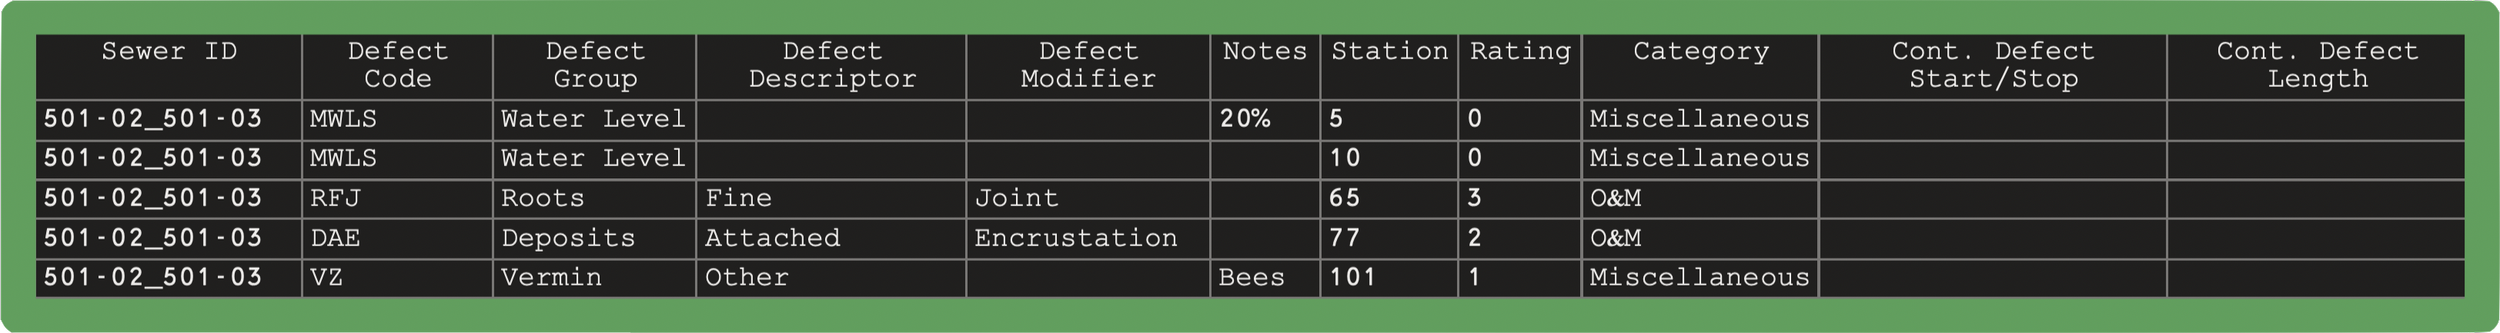
The Column now has three levels of description and a notes section.
Defect Group - This is the highest level of description for defects. This is meant to put the defect in the most broad category, according to NASSCO. (Ex. Infiltration, Roots, Deposits, Crack)
Defect Descriptor - This level is meant to describe the defect group. (Are the roots fine or in a ball?)
Defect Modifier - This level provides more context to the defect. (The defect is in a Joint)
With this configuration, it is easier to search for broader defects, like where every crack is located, when doing asset assessment. It is also very useful when creating other datasets with this one. Private sewer laterals which tap into our sewers are also noted during these inspections, and come in many different types - Some are installed when the pipe was built, some have broken into the sewer pipe, some have been capped off, others may have just been opened and abandoned.
This Sewer Tap layer is very useful for other operations, especially corrective maintenance when citizens call in with issues.